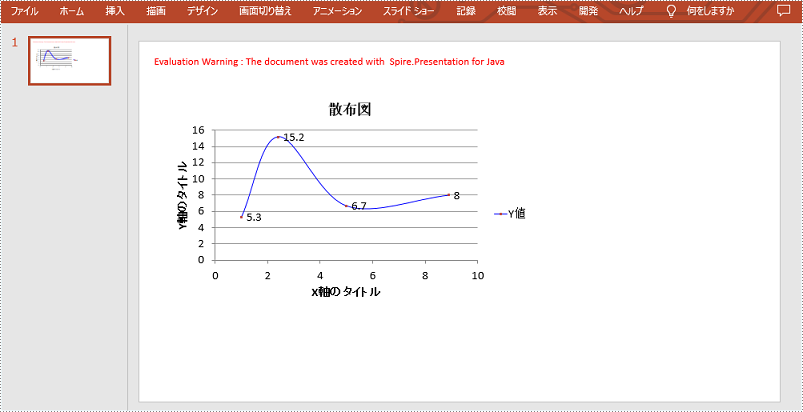
散布図(XY)は、2セットの変数間の関係を示す2次元グラフです。各散布図には、水平軸(x軸)と垂直軸(y軸)があり、データの系列を1つだけ受け入れます。この記事では、Spire.Presentation for Java を使用して PowerPoint スライドに散布図を追加する方法を示します。
Spire.Presentation for Java をインストールします
まず、Spire.Presentation for Java を Java プロジェクトに追加する必要があります。JAR ファイルは、このリンクからダウンロードできます。Maven を使用する場合は、次のコードをプロジェクトの pom.xml ファイルに追加する必要があります。
<repositories>
    <repository>
        <id>com.e-iceblue</id>
        <name>e-iceblue</name>
        <url>https://repo.e-iceblue.com/nexus/content/groups/public/</url>
    </repository>
</repositories>
<dependencies>
    <dependency>
        <groupId>e-iceblue</groupId>
        <artifactId>spire.presentation</artifactId>
        <version>8.8.1</version>
    </dependency>
</dependencies>
PowerPoint で散布図を作成する
Spire.Presentation for Java の ShapeCollection.appendChart(ChartType type, Rectangle2D rectangle, boolean init) メソッドを使用して、スライドに特定の種類のグラフを追加できます。ChartType 列挙型は、散布図、棒グラフ、円グラフなどを含む73種類のグラフが事前に定義されています。以下に、PowerPoint に散布図を追加する主な手順を示します。
- Presentation オブジェクトを作成します。
- ShapeCollection.appendChart() メソッドを使用して、特定のスライドに散布図を追加します。
- ChartData.get().setValue() メソッドを使用してグラフのデータを設定します。
- IChart インターフェイスの下のメソッドを使用して、グラフのタイトル、軸のタイトル、シリーズのラベルなどを設定します。
- グリッド線のスタイルとデータ点線のスタイルを設定します。
- Presentation.saveToFile() メソッドを使用して、結果ファイルを保存します。
- Java
import com.spire.presentation.FileFormat;
import com.spire.presentation.Presentation;
import com.spire.presentation.SlideSizeType;
import com.spire.presentation.TextLineStyle;
import com.spire.presentation.charts.ChartType;
import com.spire.presentation.charts.IChart;
import com.spire.presentation.charts.entity.ChartDataLabel;
import com.spire.presentation.drawing.FillFormatType;

import java.awt.*;
import java.awt.geom.Rectangle2D;

public class CreateScatterChart {

    public static void main(String[] args) throws Exception {

        //Presentationオブジェクトを作成する
        Presentation presentation = new Presentation();
        presentation.getSlideSize().setType(SlideSizeType.SCREEN_16_X_9);

        //最初のスライドに散布図を追加する
        IChart chart = presentation.getSlides().get(0).getShapes().appendChart(ChartType.SCATTER_SMOOTH_LINES_AND_MARKERS,new Rectangle2D.Float(40, 80, 550, 320),false);

        //グラフのタイトルを設定する
        chart.getChartTitle().getTextProperties().setText("散布図");
        chart.getChartTitle().getTextProperties().isCentered(true);
        chart.getChartTitle().setHeight(20f);
        chart.hasTitle(true);

        //グラフのデータを設定する
        Double[] xData = new Double[] { 1.0, 2.4, 5.0, 8.9 };
        Double[] yData = new Double[] { 5.3, 15.2, 6.7, 8.0 };
        chart.getChartData().get(0,0).setText("X値");
        chart.getChartData().get(0,1).setText("Y値");
        for (int i = 0; i < xData.length; i++) {
            chart.getChartData().get(i+1,0).setValue(xData[i]);
            chart.getChartData().get(i+1,1).setValue(yData[i]);
        }

        //シリーズのラベルを設定する
        chart.getSeries().setSeriesLabel(chart.getChartData().get("B1","B1"));

        //X値とY値を設定する
        chart.getSeries().get(0).setXValues(chart.getChartData().get("A2","A5"));
        chart.getSeries().get(0).setYValues(chart.getChartData().get("B2","B5"));

        //データのラベルを追加する
        for (int i = 0; i < 4; i++)
        {
            ChartDataLabel dataLabel = chart.getSeries().get(0).getDataLabels().add();
            dataLabel.setLabelValueVisible(true);
        }

        //主軸のタイトルと副軸のタイトルを設定する
        chart.getPrimaryValueAxis().hasTitle(true);
        chart.getPrimaryValueAxis().getTitle().getTextProperties().setText("X軸のタイトル");
        chart.getSecondaryValueAxis().hasTitle(true);
        chart.getSecondaryValueAxis().getTitle().getTextProperties().setText("Y軸のタイトル");

        //グリッド線を設定する
        chart.getSecondaryValueAxis().getMajorGridTextLines().setFillType(FillFormatType.SOLID);
        chart.getSecondaryValueAxis().getMajorGridTextLines().setStyle(TextLineStyle.THIN_THIN);
        chart.getSecondaryValueAxis().getMajorGridTextLines().getSolidFillColor().setColor(Color.GRAY);
        chart.getPrimaryValueAxis().getMajorGridTextLines().setFillType(FillFormatType.NONE);

        //データ点線を設定する
        chart.getSeries().get(0).getLine().setFillType(FillFormatType.SOLID);
        chart.getSeries().get(0).getLine().setWidth(0.1f);
        chart.getSeries().get(0).getLine().getSolidFillColor().setColor(Color.BLUE);

        //結果ファイルを保存する
        presentation.saveToFile("output/ScatterChart.pptx", FileFormat.PPTX_2016);
        presentation.dispose();
    }
}
一時ライセンスを申請する
結果ドキュメントから評価メッセージを削除したい場合、または機能制限を取り除く場合は、についてこのメールアドレスはスパムボットから保護されています。閲覧するにはJavaScriptを有効にする必要があります。にお問い合わせ、30 日間有効な一時ライセンスを取得してください。